Biomarker Identification Service
Introduction
The MObyDiCK platform offers a biomarker identification service, designed to revolutionize the early stages of drug discovery. By leveraging advanced systems biology analysis and single-cell omics data, MObyDiCK constructs detailed gene regulatory networks that go beyond traditional correlation-based methods. MObyDiCK uncovers causal relationships between genes, allowing for precise identification of predictive biomarkers with guaranteed delivery of comprehensive results within 3 months.
Input Requirements
1. Gene Expression Data
(Choose ONE Format)
barcodes.tsv.gz— Cell identifiersfeatures.tsv.gz— Gene identifiers (orgenes.tsv.gz)matrix.mtx.gz— Sparse gene expression matrix
.h5ad(AnnData format; Python-compatible)- Requirements:
- Raw count matrix in
adata.raw.X - Pseudotime values stored in
adata.obs["pseudotime"]oradata.obsm["pseudotime"]
.csv(Gene count matrix)- Requirements:
- Rows (obs) = Cell IDs, Columns (vars) = Gene IDs
- Ensure cell IDs match those in the metadata
- Filename must be ‘Count.csv’
2. Metadata Table
Pseudotime(Required)Cluster(Optional)- Useful for comparing clusters along the pseudotime (e.g., late vs. early stage)
- If specific clusters should be compared, include them as additional columns in the metadata.
- If none provided, MObyDiCK runs Louvain clustering by default.
.h5ad or .csv- Required column:
Pseudotime(numeric values representing cell trajectory ordering) - Optional column:
Cluster(e.g., cell type, stage) - Index:
Cell ID(must match expression data Cell IDs) - CSV Filename must be ‘Metadata.csv’
Output
A summarized PDF file will be provided as part of this service, including:
Network Model Summary
A summary of dynamic network models with detailed Boolean functions.
Biomarker Identification
Identification of predictive biomarkers through network analysis.
In Silico Biomarker Validation
Computational validation of biomarker robustness and mechanisms.
In Vitro Biomarker Validation
Experimental validation using cell-based assays for identified biomarkers (if applicable).
Use Case
Example: EGFR inhibitor resistance
Non-small cell lung cancer (NSCLC) comprises adenocarcinoma and squamous cell carcinoma and is the most frequent histological subtype of lung cancer, accounting for approximately 85% of all patients. The Epidermal Growth Factor Receptor (EGFR) is the most mutated in NSCLC. Particularly, EGFR mutations in exons 18-21 were commonly identified among patients, accounting for about 60 % of lung adenocarcinomas.
EGFR inhibitors are used in patients with EGFR mutant NSCLC, but some EGFR mutant patients have showed resistance to EGFR inhibitors. Generally, specific mutations are known as biomarkers of this resistance (e.g., EGFR T790M amplification), and new EGFR inhibitors targeting such mutations have been developed (e.g., Osimertinib). However, a small subset of cancer population can exhibit drug tolerance without adding genetic alterations, and these drug-tolerant persisters (DTPs) acquire resistance to EGFR inhibitors, including Osimertinib and Erlotinib, contributing to further cancer evolution and recurrence. While the transcriptomic profile of DTP cells is known, the driving factors remain largely unidentified.
Example INPUT
- Data Source: Publicly available scRNA-seq data from EGFR mutant patients in LUAD and LUSC (Zhang et al., 2022).Download Here! (Lung Cancer)The analysis focused specifically on the data subset for PatientID 'PS05'.
- Key Analysis Signature: DEGs between DTP and BL (untreated baseline) tumor cells identified from transcriptomic data (Moghal et al., 2023). We analyzed the state transition related to EGFR inhibitor resistance based on this DTP signature.
- Trajectory & States: Dynamic trajectory (
Pseudotime) inferred using monocle2 and also designated resistant and sensitive states (Cluster).
Example OUTPUT Workflow & Results
Data-to-Model (D2M) WorkflowLEVEL 1
D2M is the key component of MObyDiCK to construct dynamic network models.
- MObyDiCK performs differential gene expression analysis to identify marker genes for each
Clusterin a single-cell dataset. Among them, marker genes from the early and late clusters are selected as network genes. - MObyDiCK platform generates Boolean network ensembles with the
.bnetformat. - A summary of dynamic network models:

Model-to-Target (M2T) WorkflowLEVEL 2
M2T is the key component of MObyDiCK for biomarker identification service.
- Phenotype landscape analysis: Attractor refers to a set of states that the complex system eventually reaches and remains a stable pattern (in this context, referring to the cellular phenotype). In this study, based on the EGFR inhibitor resistant phenotype markers, BL (baseline) and DTP (resistant) phenotypes are defined. By calculating the ratio of sensitive phenotype, we prioritized the gene candidates.
- Predictive biomarker selection: Through single-node perturbation analysis, the most effective genes to predict desired drug responses are identified—used as predictive biomarkers—, ensuring robustness against data noise. Based on the EGFR inhibitor resistant phenotype markers, we computed MObyDiCK score which indicates the level of drug sensitivity to an EGFR inhibitor (ranging from 0 to 1). We finally identified GSTP1 as a key biomarker.
In Silico Biomarker ValidationLEVEL 3
Computational validation of identified biomarkers and mechanistic insights.
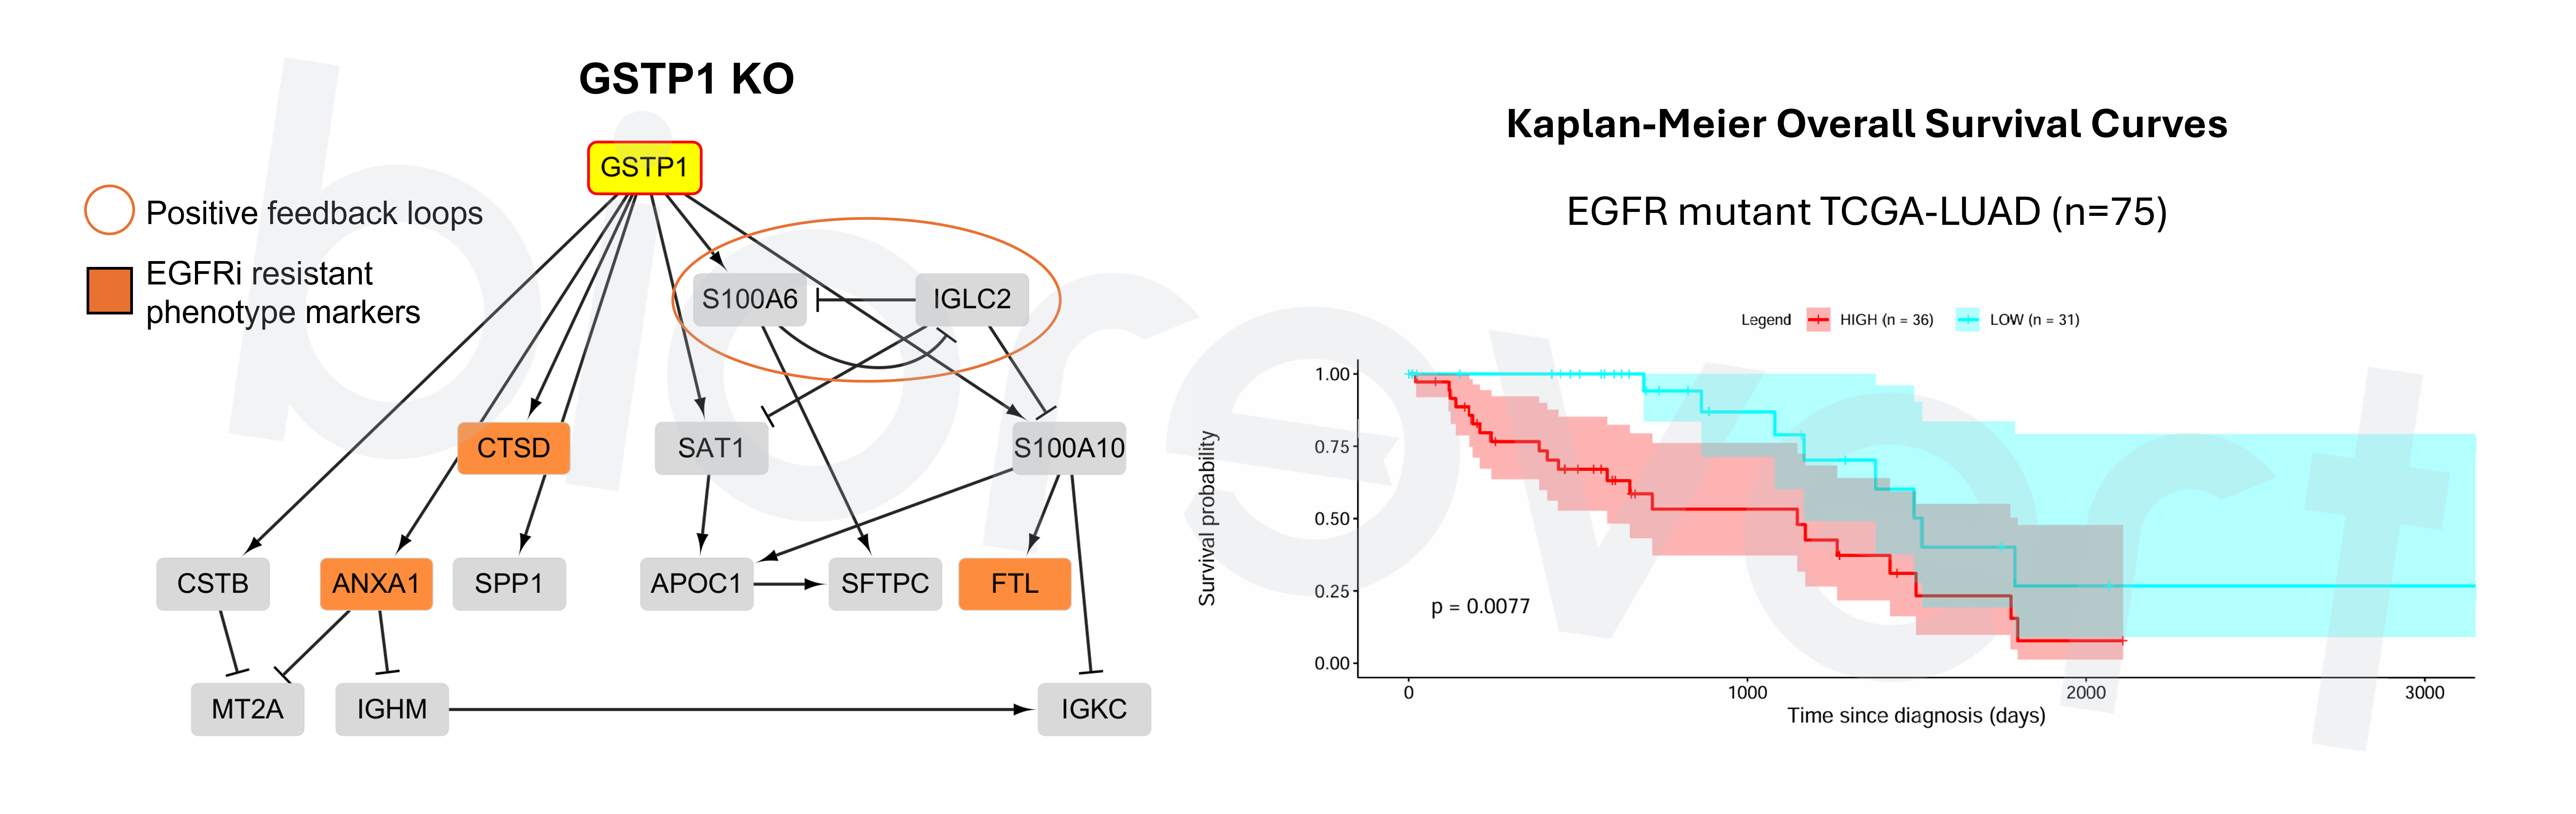
- Mechanistic insight into GSTP1 KO in combination with EGFR inhibitor: GSTP1 has an impact on S100A6, regulated by several transcription factors, including c-Myc, NF-κB, and Nrf2. Thus, we suggested that dynamic interactions involving S100A6 may play a critical role in overcoming resistance to EGFR inhibitors in lung cancer cells.
- GSTP1-high clusters showed significantly poor overall survival in EGFR mutant TCGA-LUAD samples. This implies that GSTP1 could be used as a predictive biomarker for responsiveness to EGFR inhibitors.
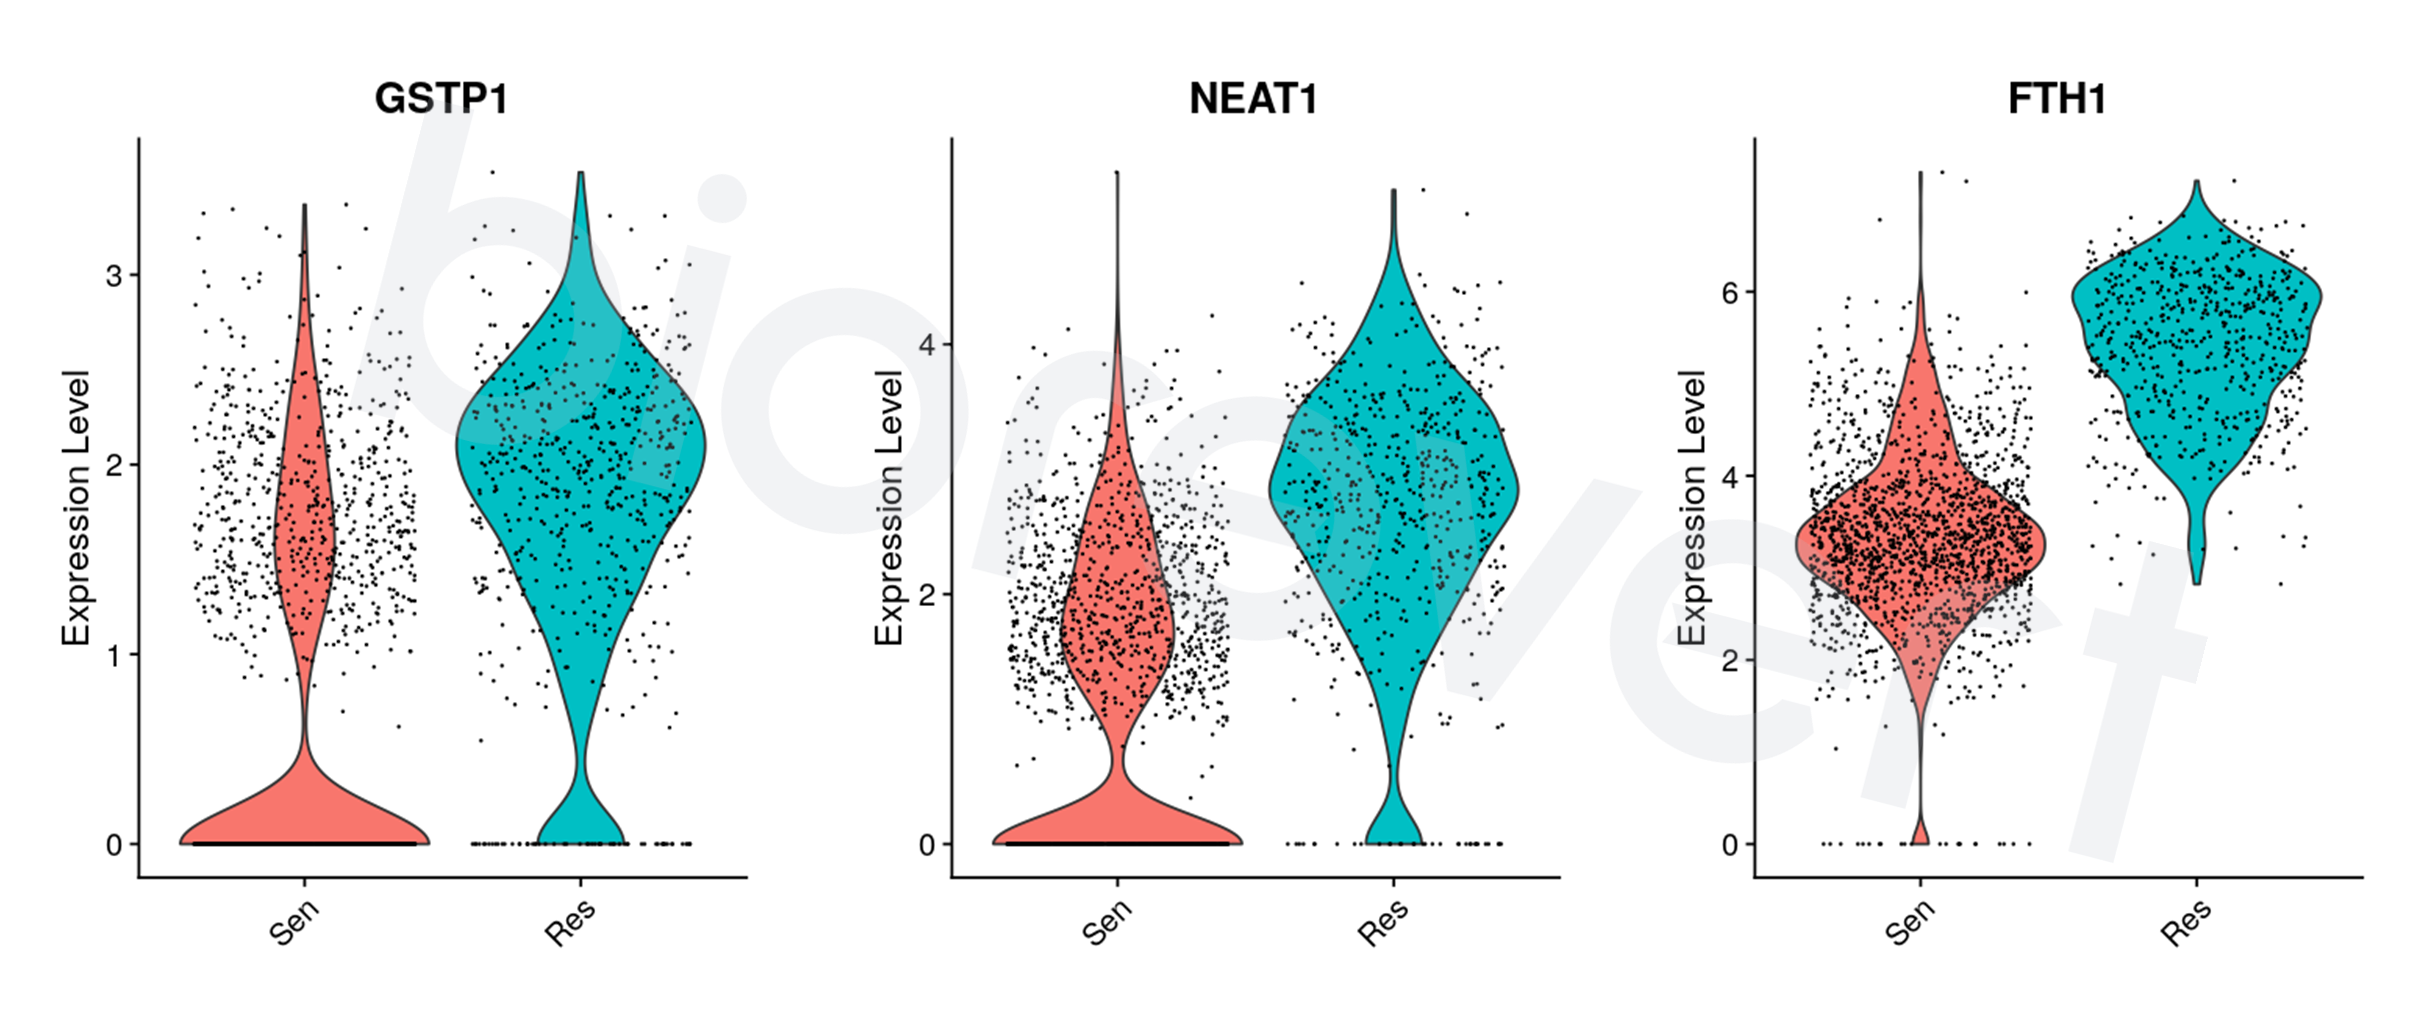
- Identified candidates showed higher expression levels in Res clusters (inferred by DTP-enriched signature) across a different dataset (Kim et al., 2020).
In Vitro Biomarker ValidationLEVEL 4
Experimental validation based on public literature findings.
Please note that this supporting evidence presented here originates from publicly available data from published literature, not from in-house research conducted by biorevert Inc.
Wang, Si‐Qi, et al. reported that reducing GSTP1 significantly decreased lung cancer stem cell characteristics and enhanced sensitivity to certain TKIs (gefitinib, erlotinib, and afatinib). This supports the potential for the GSTP1 inhibitor, ezastiostat, to be combined with TKIs as a therapeutic strategy.
References
[1] Mikubo, M., et al. (2021). Mechanism of drug tolerant persister cancer cells: the landscape and clinical implication for therapy. Journal of Thoracic Oncology. (PMID: 34352380)
[2] Moghal, N., et al. (2023). Single-cell analysis reveals transcriptomic features of drug-tolerant persisters and stromal adaptation in a patient-derived EGFR-mutated lung adenocarcinoma xenograft model. Journal of Thoracic Oncology. (PMID: 36535627)
[3] Zhang, L., et al. (2022). Integrated single-cell RNA sequencing analysis reveals distinct cellular and transcriptional modules associated with survival in lung cancer. Signal Transduction and Targeted Therapy. (PMID: 35027529)
[4] Zhen, S., et al. (2024). NEAT1_1 confers gefitinib resistance in lung adenocarcinoma through promoting AKR1C1-mediated ferroptosis defence. Cell Death Discovery. (PMID: 38472205)
[5] Ni, Y., et al. (2023). Natural product manoalide promotes EGFR-TKI sensitivity of lung cancer cells by KRAS-ERK pathway and mitochondrial Ca2+ overload-induced ferroptosis. Frontiers in Pharmacology. (PMID: 36712673)
[6] Wang, SQ., et al. (2023). Targeting GSTP1 as therapeutic strategy against lung adenocarcinoma stemness and resistance to tyrosine kinase inhibitors. Advanced Science. (PMID: 36709476)