Target Identification Service
Introduction
The MObyDiCK platform offers a target identification service, designed to revolutionize the early stages of drug discovery. By leveraging advanced systems biology analysis and single-cell omics data, MObyDiCK constructs gene regulatory network models that go beyond traditional correlation-based methods. MObyDiCK uncovers causal relationships between genes, allowing for the identification of first-in-class drug targets with guaranteed delivery of comprehensive results within 3 months.
Input Requirements
1. Gene Expression Data
(Choose ONE Format)
barcodes.tsv.gz— Cell identifiersfeatures.tsv.gz— Gene identifiers (orgenes.tsv.gz)matrix.mtx.gz— Sparse gene expression matrix
.h5ad(AnnData format; Python-compatible)- Requirements:
- Raw count matrix in
adata.raw.X - Pseudotime values stored in
adata.obs["pseudotime"]oradata.obsm["pseudotime"]
.csv(Gene count matrix)- Requirements:
- Rows (obs) = Cell IDs, Columns (vars) = Gene IDs
- Ensure cell IDs match those in the metadata
- Filename must be ‘Count.csv’
2. Metadata Table
Pseudotime(Required)Cluster(Optional)- Useful for comparing clusters along the pseudotime (e.g., late vs. early stage)
- If specific clusters should be compared, include them as additional columns in the metadata.
- If none provided, MObyDiCK runs Louvain clustering by default.
.h5ad or .csv- Required column:
Pseudotime(numeric values representing cell trajectory ordering) - Optional column:
Cluster(e.g., cell type, stage) - Index:
Cell ID(must match expression data Cell IDs) - CSV Filename must be ‘Metadata.csv’
Output
A summarized PDF file will be provided as part of this service, including:
Network Model Summary
A summary of dynamic network models with detailed Boolean functions.
Novel Target Identification
Identification of novel target genes based on network analysis.
In Silico Target Validation
Computational validation of target robustness and mechanistic insights.
In Vitro Target Validation
Experimental validation using cell-based assays for identified targets.
Use Case
Example: KRAS inhibitor resistance
Non-small cell lung cancer (NSCLC) is the most frequent histological subtype of lung cancer, accounting for approximately 85% of all patients. Activating mutations in KRAS are the most common oncogenic drivers, occurring in approximately 10~30% of NSCLC patients. In particular, a glycine to cysteine mutations at residue 12 (G12C) of RAS is enriched in KRAS mutant NSCLC.
Thus, the development of KRAS inhibitors has been a major focus in lung cancer research, though progress remained elusive for many years. Recently, significant breakthroughs have been achieved with sotorasib and adagrasib, approved by the US FDA for treating NSCLC patients harboring KRAS G12C mutations. These advances have established a new paradigm for KRAS-mutant NSCLC treatment. However, they are limited by low efficacy, side effects (e.g., diarrhea, fatigue), and their resistance. It is currently unclear how to predict responsive patient subsets and suggest combination therapeutic strategies for clinical application.
Example INPUT
- Data Source: We used publicly available scRNA-seq data from KRAS mutant patients in NSCLC (Laughney et al., 2020).Download Here! (The single-cell lung cancer atlas)The analysis focused specifically on the data subset for ‘Laughney_Massague_2020_LX699’.
- Key Analysis Context: Clinical outcome prediction using drug-tolerant persister (DTP) signatures based on previous studies (Araujo et al., 2024; Guo et al., 2017).
- Trajectory & States: We inferred a dynamic trajectory (
Pseudotime) using monocle2 and also designated resistant and sensitive states (Cluster).
Example OUTPUT Workflow & Results
Data-to-Model (D2M) WorkflowLEVEL 1
D2M is the key component of MObyDiCK to construct dynamic network models.
- MObyDiCK performs differential gene expression analysis to identify marker genes for each
Clusterin a single-cell dataset. Among them, marker genes from the early and late clusters are selected as network genes (about 15~20 nodes). - MObyDiCK platform generates Boolean network ensembles with the
.bnetformat. - A summary of dynamic network models:

Model-to-Target (M2T) Workflow LEVEL 2
M2T is the key component of MObyDiCK for target identification.
- Attractor analysis & Target identification: Attractor refers to a set of states that the complex system eventually reaches and remains a stable pattern (in this context, referring to the cellular phenotype). Based on the KRAS inhibitor resistant phenotype markers, we computed MObyDiCK score which indicates the level of drug sensitivity to a KRAS inhibitor (ranging from 0 to 1). We finally identified TFF3 as a novel target gene.
- Notably, MObyDiCK prioritized more prominent and mechanistically relevant candidates compared to those identified using a deep learning-based approach. When we applied the pretrained Geneformer from the CELLxGENE Census, it predicted a broader set of candidates—primarily selected based on FDR thresholding (detected in ≥ 80 cells)—but with less mechanistic specificity.
In Silico Target ValidationLEVEL 3
Computational validation of identified targets and mechanistic insights.
- Mechanistic insight into TFF3 KO in combination with KRAS inhibitor: A positive feedback loop between TFF3 and SLPI may contribute to the development of KRAS inhibitor resistance in NSCLC. These genes exhibit elevated expression levels in the cluster identified 72 h after KRAS inhibitor treatment—characterized by the DTP-enriched signature—across an independent dataset.
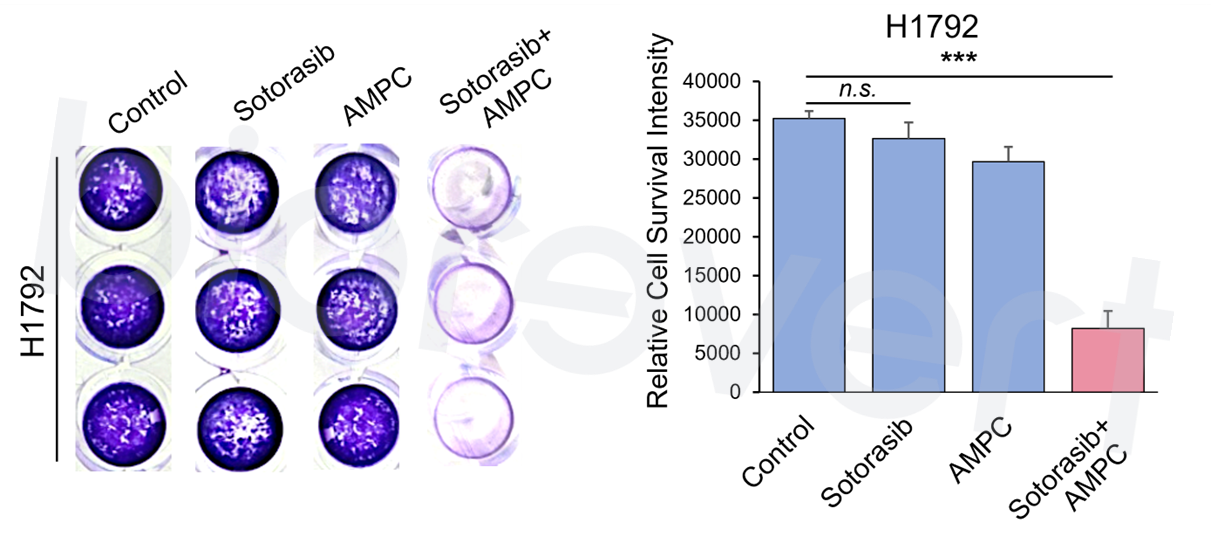
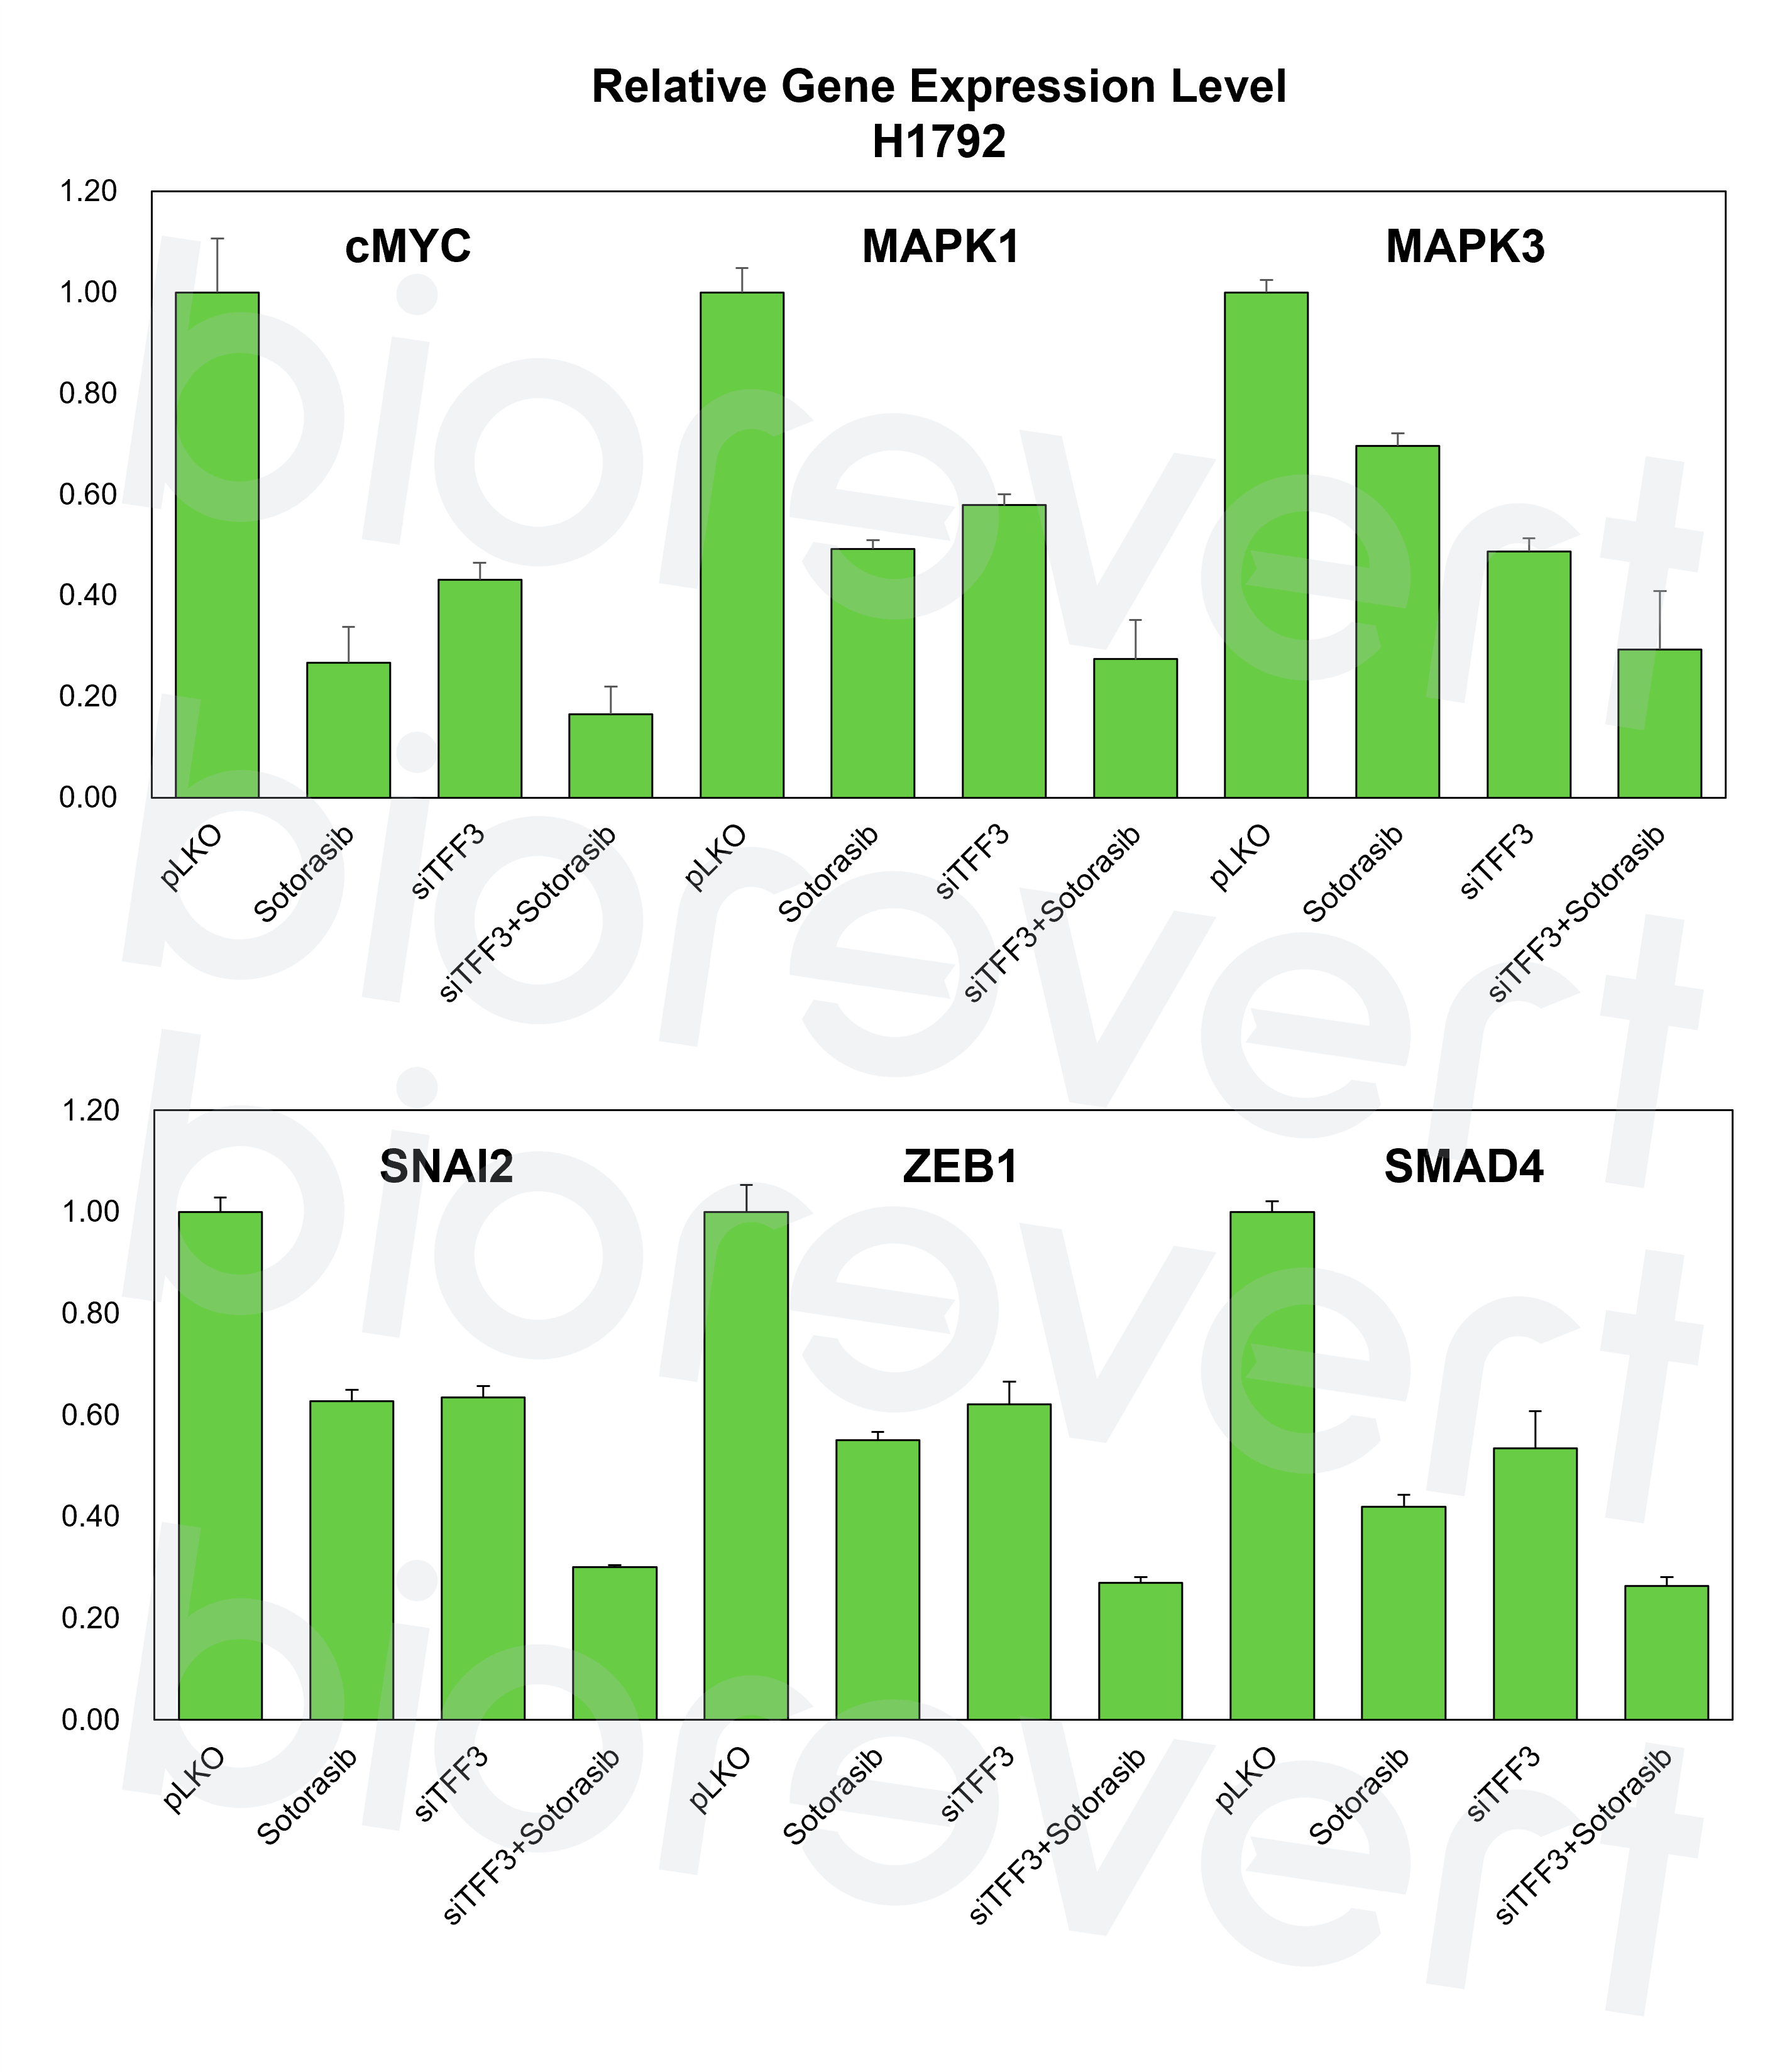
In Vitro Target ValidationLEVEL 4
Experimental validation based on cell line experiments.
- We experimentally validated that inhibiting TFF3 effectively enhances the response to KRAS inhibitor. We examined the effect of a small molecule that inhibits TFF3 dimerization (AMPC) in combination with a KRAS inhibitor (sotorasib) in a KRAS G12C-mutant cell line, H1792. As expected, inhibition of TFF3 by AMPC enhanced the responsiveness to sotorasib.
Key Notes
- MObyDiCK identified novel target gene to overcome resistance to KRAS inhibitors.
- MObyDiCK prioritized candidates that are more prominent and mechanistically relevant compared to those identified using a deep learning-based approach (pretrained Geneformer from the CELLxGENE Census).
- We will present our findings at the AACR Annual Meeting 2025. Our poster (#3706) will be displayed in Poster Section 47 starting at 2 p.m. - 5 p.m on April 28.
References
[1] Skoulidis, F., & Heymach, J. V. (2019). Co-occurring genomic alterations in non-small-cell lung cancer biology and therapy. Nature Reviews Cancer.
[2] Oya, Y., Imaizumi, K., & Mitsudomi, T. (2024). The next-generation KRAS inhibitors… What comes after sotorasib and adagrasib?. Lung Cancer.
[3] Salcher, S., et al. (2022). High-resolution single-cell atlas reveals diversity and plasticity of tissue-resident neutrophils in non-small cell lung cancer. Cancer Cell.
[4] Laughney, A. M., et al. (2020). Regenerative lineages and immune-mediated pruning in lung cancer metastasis. Nature Medicine.
[5] Xue, J. Y., et al. (2020). Rapid non-uniform adaptation to conformation-specific KRAS (G12C) inhibition. Nature.
[6] Araujo, H. A., et al. (2024). Mechanisms of Response and Tolerance to Active RAS Inhibition in KRAS-Mutant Non–Small Cell Lung Cancer. Cancer Discovery.
[7] Guo, M., et al. (2017). Gene signature driving invasive mucinous adenocarcinoma of the lung. EMBO Molecular Medicine.